Time Series Cross-validation 4: Forecasting the S&P 500
Note: This post is NOT financial advice! This is just a fun way to explore some of the capabilities R has for importing and manipulating data.
I finally got around to publishing my time series cross-validation package to github, and I plan to push it out to CRAN shortly:
devtools::install_github("zachmayer/cv.ts")
Then run the following script to check it out:
library(forecast)
library(cv.ts)
set.seed(42)

#Download S&P 500 data and adjust from splits/dividends
library(quantmod)
getSymbols('^GSPC', from='1990-01-01')
#> [1] "GSPC"
GSPC <- adjustOHLC(GSPC, symbol.name='^GSPC')

#Calculate monthly returns
GSPC <- to.monthly(GSPC, indexAt='lastof')
GSPC <- Cl(GSPC)

#Convert from xts to ts
GSPC <- ts(GSPC, start=c(1990,1), frequency=12)

#Define cross validation parameters
myControl <- tseriesControl(
                  minObs=60,
                  stepSize=1,
                  maxHorizon=12,
                  fixedWindow=TRUE,
                  preProcess=FALSE,
                  ppMethod='guerrero',
                  summaryFunc=tsSummary
                  )

#Forecast using several models
result_naive <- cv.ts(GSPC, naiveForecast, myControl, progress=FALSE)
myControl$preProcess <- TRUE
result_autoarima <- cv.ts(GSPC, auto.arimaForecast, myControl, ic='bic', progress=FALSE)
result_ets <- cv.ts(GSPC, etsForecast, myControl, ic='bic', progress=FALSE)
library(reshape2)
library(ggplot2)
plotData <- data.frame(
  horizon=1:12
  ,naive=result_naive$results$MAPE[1:12]
  ,arima=result_autoarima$results$MAPE[1:12]
  ,ets=result_ets$results$MAPE[1:12]
  )
plotData <- melt(plotData, id.vars='horizon', value.name='MAPE', variable.name='model')
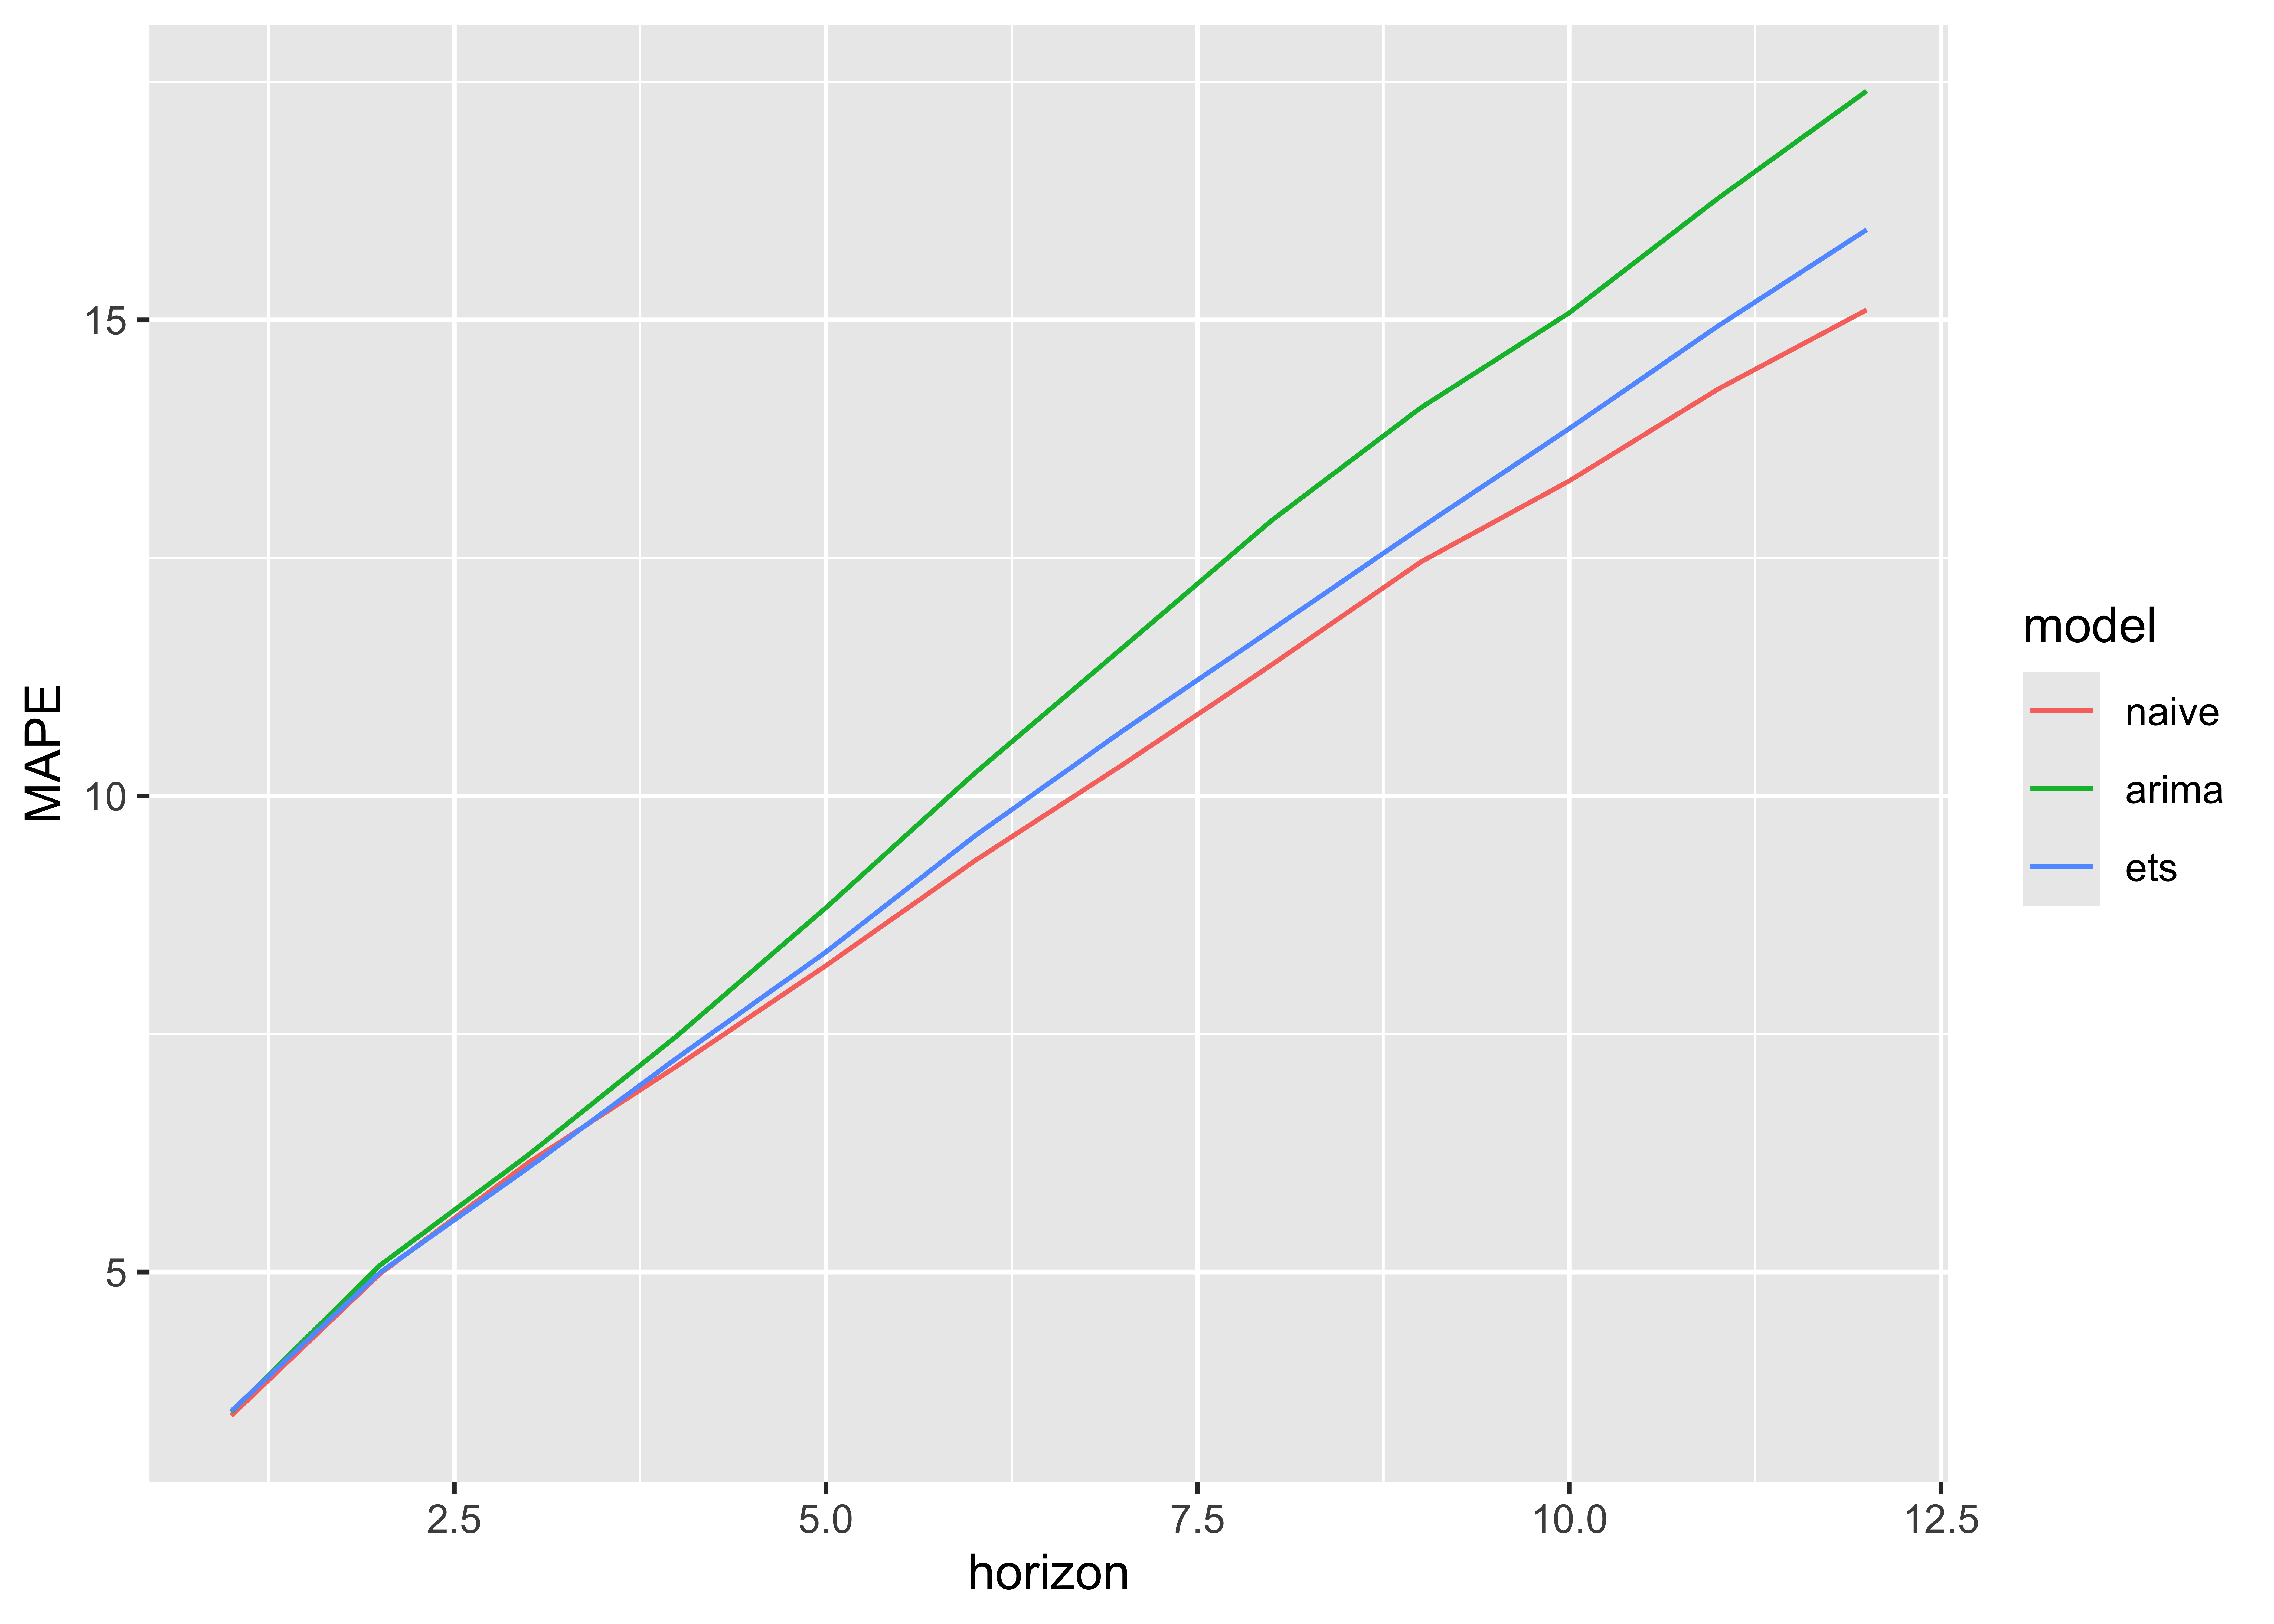
print(ggplot(plotData, aes(horizon, MAPE, color=model)) + geom_line())

Forecasting equities prices is hard!