Time Series Cross-validation 2
In my previous post, I shared a function for parallel time-series cross-validation, based on Rob Hyndman’s code. I thought I’d expand on that example a little bit, and share some additional wrapper functions I wrote to test other forecasting algorithms. Before you try this at home, be sure to load the cv.ts and tsSummary functions from my last post.
devtools::install_github("zachmayer/cv.ts")
These functions add random walk models, the theta method, structural time series, seasonal decomposition, and simple mean forecasts to our cross-validation repertoire. The following code fits each of these models to the example dataset, and charts their accuracies out to a forecast horizon of 12 months. Note that none of this code runs in parallel, but if you wish, you can parallelize things by loading your favorite foreach backend. I would suggest running meanf, rwf, thetaf, and the linear model before loading a parallel backend, as all of these methods run very fast and do not need parallelization.
set.seed(1)
library(cv.ts)
library(fpp) # To load the data set a10
myControl <- tseriesControl(
                  minObs=60,
                  stepSize=1,
                  maxHorizon=12,
                  fixedWindow=FALSE,
                  summaryFunc=tsSummary
                  )

#Linear model
LM <- cv.ts(a10, lmForecast, tsControl=myControl, lambda=0, progress=FALSE)

#Arima
AR <- cv.ts(a10, arimaForecast, tsControl=myControl,
        order=c(3,0,1),
        seasonal=list(order=c(0,1,1), period=12),
        include.drift=TRUE,
        lambda=0,
        method="ML",
    progress=FALSE)

#ETS
ETS <- cv.ts(a10, etsForecast, tsControl=myControl, model="MMM", damped=TRUE, progress=FALSE)

#Random Walk model
RW <- cv.ts(a10, rwForecast, tsControl=myControl, lambda=0, progress=FALSE)

#Theta  model
TM <- cv.ts(a10, thetaForecast, tsControl=myControl, progress=FALSE)

#StructTS
sts <- cv.ts(a10, stsForecast, tsControl=myControl, progress=FALSE)

#stl (ets)
stl.etsForecast <- function(x,h,...) {
    require(forecast)
    fit <- stl(x, s.window='periodic',  ...)
    forecast(fit, h=h, level=99, method='ets')$mean
}
stlETS <- cv.ts(a10, stl.etsForecast, tsControl=myControl, progress=FALSE)

#stl (arima)
stl.arimaForecast <- function(x,h,...) {
    require(forecast)
    fit <- stl(x, s.window='periodic',  ...)
    forecast(fit, h=h, level=99, method='arima')$mean
}
stlAR <- cv.ts(a10, stl.arimaForecast, tsControl=myControl, progress=FALSE)

#Mean model
MM <- cv.ts(a10, meanForecast, tsControl=myControl, lambda=0, progress=FALSE)
print(LM$results)
#>    horizon         ME     RMSE       MAE       MPE     MAPE
#> 1        1 -0.2725912 1.076396 0.7791545 -2.614665 5.596926
#> 2        2 -0.2822531 1.082641 0.7871349 -2.710239 5.658250
#> 3        3 -0.2886488 1.092170 0.7976159 -2.770276 5.730474
#> 4        4 -0.2971028 1.104251 0.8103064 -2.852489 5.823448
#> 5        5 -0.3056058 1.109408 0.8189053 -2.931349 5.896185
#> 6        6 -0.3109202 1.118481 0.8248950 -2.954858 5.910637
#> 7        7 -0.3179823 1.127791 0.8343112 -3.013127 5.980584
#> 8        8 -0.3196042 1.130791 0.8345069 -3.005293 5.949104
#> 9        9 -0.3278520 1.140122 0.8434244 -3.049571 5.982685
#> 10      10 -0.3356941 1.149424 0.8525803 -3.082279 6.018591
#> 11      11 -0.3474146 1.157718 0.8618808 -3.177945 6.091796
#> 12      12 -0.3588573 1.165808 0.8711102 -3.257125 6.156913
#> 13     All -0.3137105 1.121250 0.8263188 -2.951601 5.899633
print(AR$results)
#>    horizon          ME      RMSE       MAE       MPE     MAPE
#> 1        1 -0.06952996 0.9576579 0.6864364 -0.987671 5.023620
#> 2        2 -0.08169637 0.9489235 0.6741621 -1.132339 4.872177
#> 3        3 -0.08343977 0.9977603 0.7288596 -1.231540 5.213511
#> 4        4 -0.11067162 1.0439293 0.7385081 -1.559224 5.281564
#> 5        5 -0.10842489 1.0236703 0.7313181 -1.540205 5.253661
#> 6        6 -0.11742386 1.0576470 0.7555417 -1.632494 5.399775
#> 7        7 -0.12813752 1.0642152 0.7660031 -1.733374 5.502634
#> 8        8 -0.12388781 1.0777980 0.7679234 -1.702259 5.483807
#> 9        9 -0.13108887 1.1000320 0.7790721 -1.750583 5.517787
#> 10      10 -0.13214359 1.1176414 0.7948680 -1.748940 5.599111
#> 11      11 -0.13512504 1.1228730 0.8017960 -1.799429 5.660906
#> 12      12 -0.13643063 1.1206344 0.7955103 -1.801673 5.609461
#> 13     All -0.11316666 1.0527318 0.7516666 -1.551644 5.368168
print(ETS$results)
#>    horizon        ME     RMSE       MAE      MPE     MAPE
#> 1        1 0.1132662 1.096961 0.7555067 0.811820 5.341824
#> 2        2 0.1415040 1.074570 0.7507118 1.097761 5.308178
#> 3        3 0.1823720 1.132433 0.8115826 1.338857 5.734240
#> 4        4 0.2481434 1.200547 0.8523130 1.721842 5.982308
#> 5        5 0.2926954 1.139426 0.8375651 2.005419 5.935881
#> 6        6 0.3362320 1.217865 0.8764216 2.336122 6.134923
#> 7        7 0.3962229 1.269369 0.9154994 2.738119 6.414465
#> 8        8 0.4646886 1.305978 0.9461516 3.209884 6.582228
#> 9        9 0.5291823 1.400404 0.9824138 3.658850 6.755941
#> 10      10 0.5935464 1.440317 1.0473199 4.128987 7.180029
#> 11      11 0.6613151 1.453265 1.0377274 4.550946 7.141743
#> 12      12 0.7359366 1.496950 1.0893617 5.081606 7.494982
#> 13     All 0.3912587 1.269007 0.9085479 2.723351 6.333895
print(RW$results)
#>    horizon         ME     RMSE      MAE         MPE     MAPE
#> 1        1 0.09543458 2.585797 1.633806 -0.95845153 13.08043
#> 2        2 0.21096671 2.887414 2.086827 -0.51189597 16.67390
#> 3        3 0.33081231 3.209382 2.529393  0.06451254 19.75352
#> 4        4 0.41682849 3.308153 2.775751  0.73758312 21.06015
#> 5        5 0.52570337 3.370298 2.862160  1.56063977 21.38301
#> 6        6 0.69507014 3.396107 2.823145  2.74832958 20.30018
#> 7        7 0.82473843 3.388658 2.623266  3.56873022 18.70698
#> 8        8 0.95284279 3.407171 2.479307  4.46499656 17.00680
#> 9        9 1.09209473 3.435530 2.179317  5.72888286 14.33184
#> 10      10 1.22771065 3.193096 1.960114  7.09193170 12.74699
#> 11      11 1.36907919 3.041361 1.780962  8.47030315 11.77099
#> 12      12 1.49533513 2.019274 1.575216 10.49025836 10.97966
#> 13     All 0.76971804 3.103520 2.275772  3.62131836 16.48287
print(TM$results)
#>    horizon        ME     RMSE       MAE       MPE     MAPE
#> 1        1 0.1414438 1.124566 0.7779201 0.8961364 5.519355
#> 2        2 0.2146526 1.048755 0.7339141 1.5349653 5.267887
#> 3        3 0.3227199 1.112321 0.8036286 2.1878693 5.738858
#> 4        4 0.4130905 1.269052 0.9192793 2.7478437 6.514479
#> 5        5 0.5136075 1.226529 0.9134254 3.4082862 6.478888
#> 6        6 0.6068414 1.299076 0.9541279 4.0465570 6.732974
#> 7        7 0.6985162 1.395290 1.0176665 4.6699011 7.230673
#> 8        8 0.8040296 1.446470 1.0442575 5.3879252 7.261630
#> 9        9 0.9020943 1.549383 1.1114557 6.0334980 7.546790
#> 10      10 0.9981709 1.643578 1.1884182 6.6929469 8.082402
#> 11      11 1.0962047 1.704359 1.2114312 7.3193096 8.202218
#> 12      12 1.1805648 1.747106 1.2783751 7.9333449 8.588472
#> 13     All 0.6576613 1.380540 0.9961583 4.4048820 6.930386
print(sts$results)
#>    horizon        ME     RMSE       MAE       MPE     MAPE
#> 1        1 0.1322292 1.189906 0.7910718 0.5732481 5.682266
#> 2        2 0.1218441 1.160745 0.7690927 0.4938881 5.479615
#> 3        3 0.1726573 1.274612 0.8854782 0.8130685 6.194867
#> 4        4 0.2098552 1.352418 0.9100489 1.0631908 6.294749
#> 5        5 0.2739531 1.317463 0.9246824 1.4868692 6.393195
#> 6        6 0.3245133 1.368391 0.9284159 1.8569643 6.300996
#> 7        7 0.3729194 1.354256 0.9549698 2.2106616 6.359833
#> 8        8 0.4262309 1.449674 1.0090998 2.6496248 6.522063
#> 9        9 0.4851529 1.501667 1.0201607 3.1349103 6.601353
#> 10      10 0.5587862 1.517403 1.0266501 3.6235725 6.739225
#> 11      11 0.6057247 1.516912 1.0265017 3.9462406 6.750711
#> 12      12 0.6332924 1.481829 1.0126303 4.1046011 6.716871
#> 13     All 0.3597632 1.373773 0.9382335 2.1630700 6.336312
print(stlETS$results)
#>    horizon         ME     RMSE       MAE         MPE     MAPE
#> 1        1 0.09481501 1.399557 0.9626978 -0.33015432 6.961542
#> 2        2 0.11784602 1.449846 0.9920826 -0.22376122 7.086289
#> 3        3 0.14394513 1.501930 1.0466997 -0.07239439 7.399513
#> 4        4 0.16463352 1.547879 1.0845212  0.06141392 7.563395
#> 5        5 0.19068600 1.540751 1.0930544  0.21520966 7.527287
#> 6        6 0.22018674 1.550637 1.1001592  0.40499016 7.487935
#> 7        7 0.23926495 1.532040 1.0938293  0.52066122 7.432860
#> 8        8 0.26402157 1.535811 1.1062140  0.68105696 7.553759
#> 9        9 0.29366109 1.549137 1.1033162  0.93776544 7.433063
#> 10      10 0.32807315 1.534580 1.1201419  1.22461828 7.556846
#> 11      11 0.36554544 1.580519 1.1560199  1.45853413 7.823422
#> 12      12 0.40477461 1.596769 1.1823494  1.70597119 8.010803
#> 13     All 0.23562110 1.526621 1.0867571  0.54865925 7.486393
print(stlAR$results)
#>    horizon        ME     RMSE       MAE       MPE     MAPE
#> 1        1 0.1739003 1.424801 0.9976624 0.3104650 7.206091
#> 2        2 0.2294918 1.414991 0.9998268 0.6736022 7.146767
#> 3        3 0.3045328 1.552461 1.0741247 1.0577687 7.556266
#> 4        4 0.3505149 1.544191 1.0763283 1.3742712 7.478231
#> 5        5 0.4128463 1.534394 1.0973444 1.7538387 7.503772
#> 6        6 0.4643733 1.600138 1.1191551 2.0946147 7.460619
#> 7        7 0.5116545 1.580266 1.1130254 2.3633754 7.449818
#> 8        8 0.5636323 1.551106 1.0873974 2.7064532 7.219645
#> 9        9 0.6140682 1.633457 1.0910077 3.0964276 6.922146
#> 10      10 0.6794601 1.625172 1.1186621 3.5943284 7.153659
#> 11      11 0.7487184 1.606958 1.1004704 4.0870454 7.049115
#> 12      12 0.8089905 1.638538 1.1557033 4.4918049 7.373658
#> 13     All 0.4885153 1.558873 1.0858923 2.3003330 7.293316
print(MM$results)
#>    horizon       ME     RMSE      MAE      MPE     MAPE
#> 1        1 6.501000 7.755435 6.501000 44.68929 44.68929
#> 2        2 6.564808 7.810321 6.564808 45.06144 45.06144
#> 3        3 6.630533 7.865495 6.630533 45.45272 45.45272
#> 4        4 6.695709 7.920408 6.695709 45.83359 45.83359
#> 5        5 6.759010 7.974963 6.759010 46.19040 46.19040
#> 6        6 6.824228 8.030215 6.824228 46.56190 46.56190
#> 7        7 6.875812 8.080357 6.875812 46.81968 46.81968
#> 8        8 6.928401 8.130992 6.928401 47.08238 47.08238
#> 9        9 7.005288 8.188547 7.005288 47.59036 47.59036
#> 10      10 7.079758 8.246165 7.079758 48.05113 48.05113
#> 11      11 7.151283 8.303925 7.151283 48.46478 48.46478
#> 12      12 7.222056 8.362060 7.222056 48.86117 48.86117
#> 13     All 6.853157 8.055740 6.853157 46.72157 46.72157
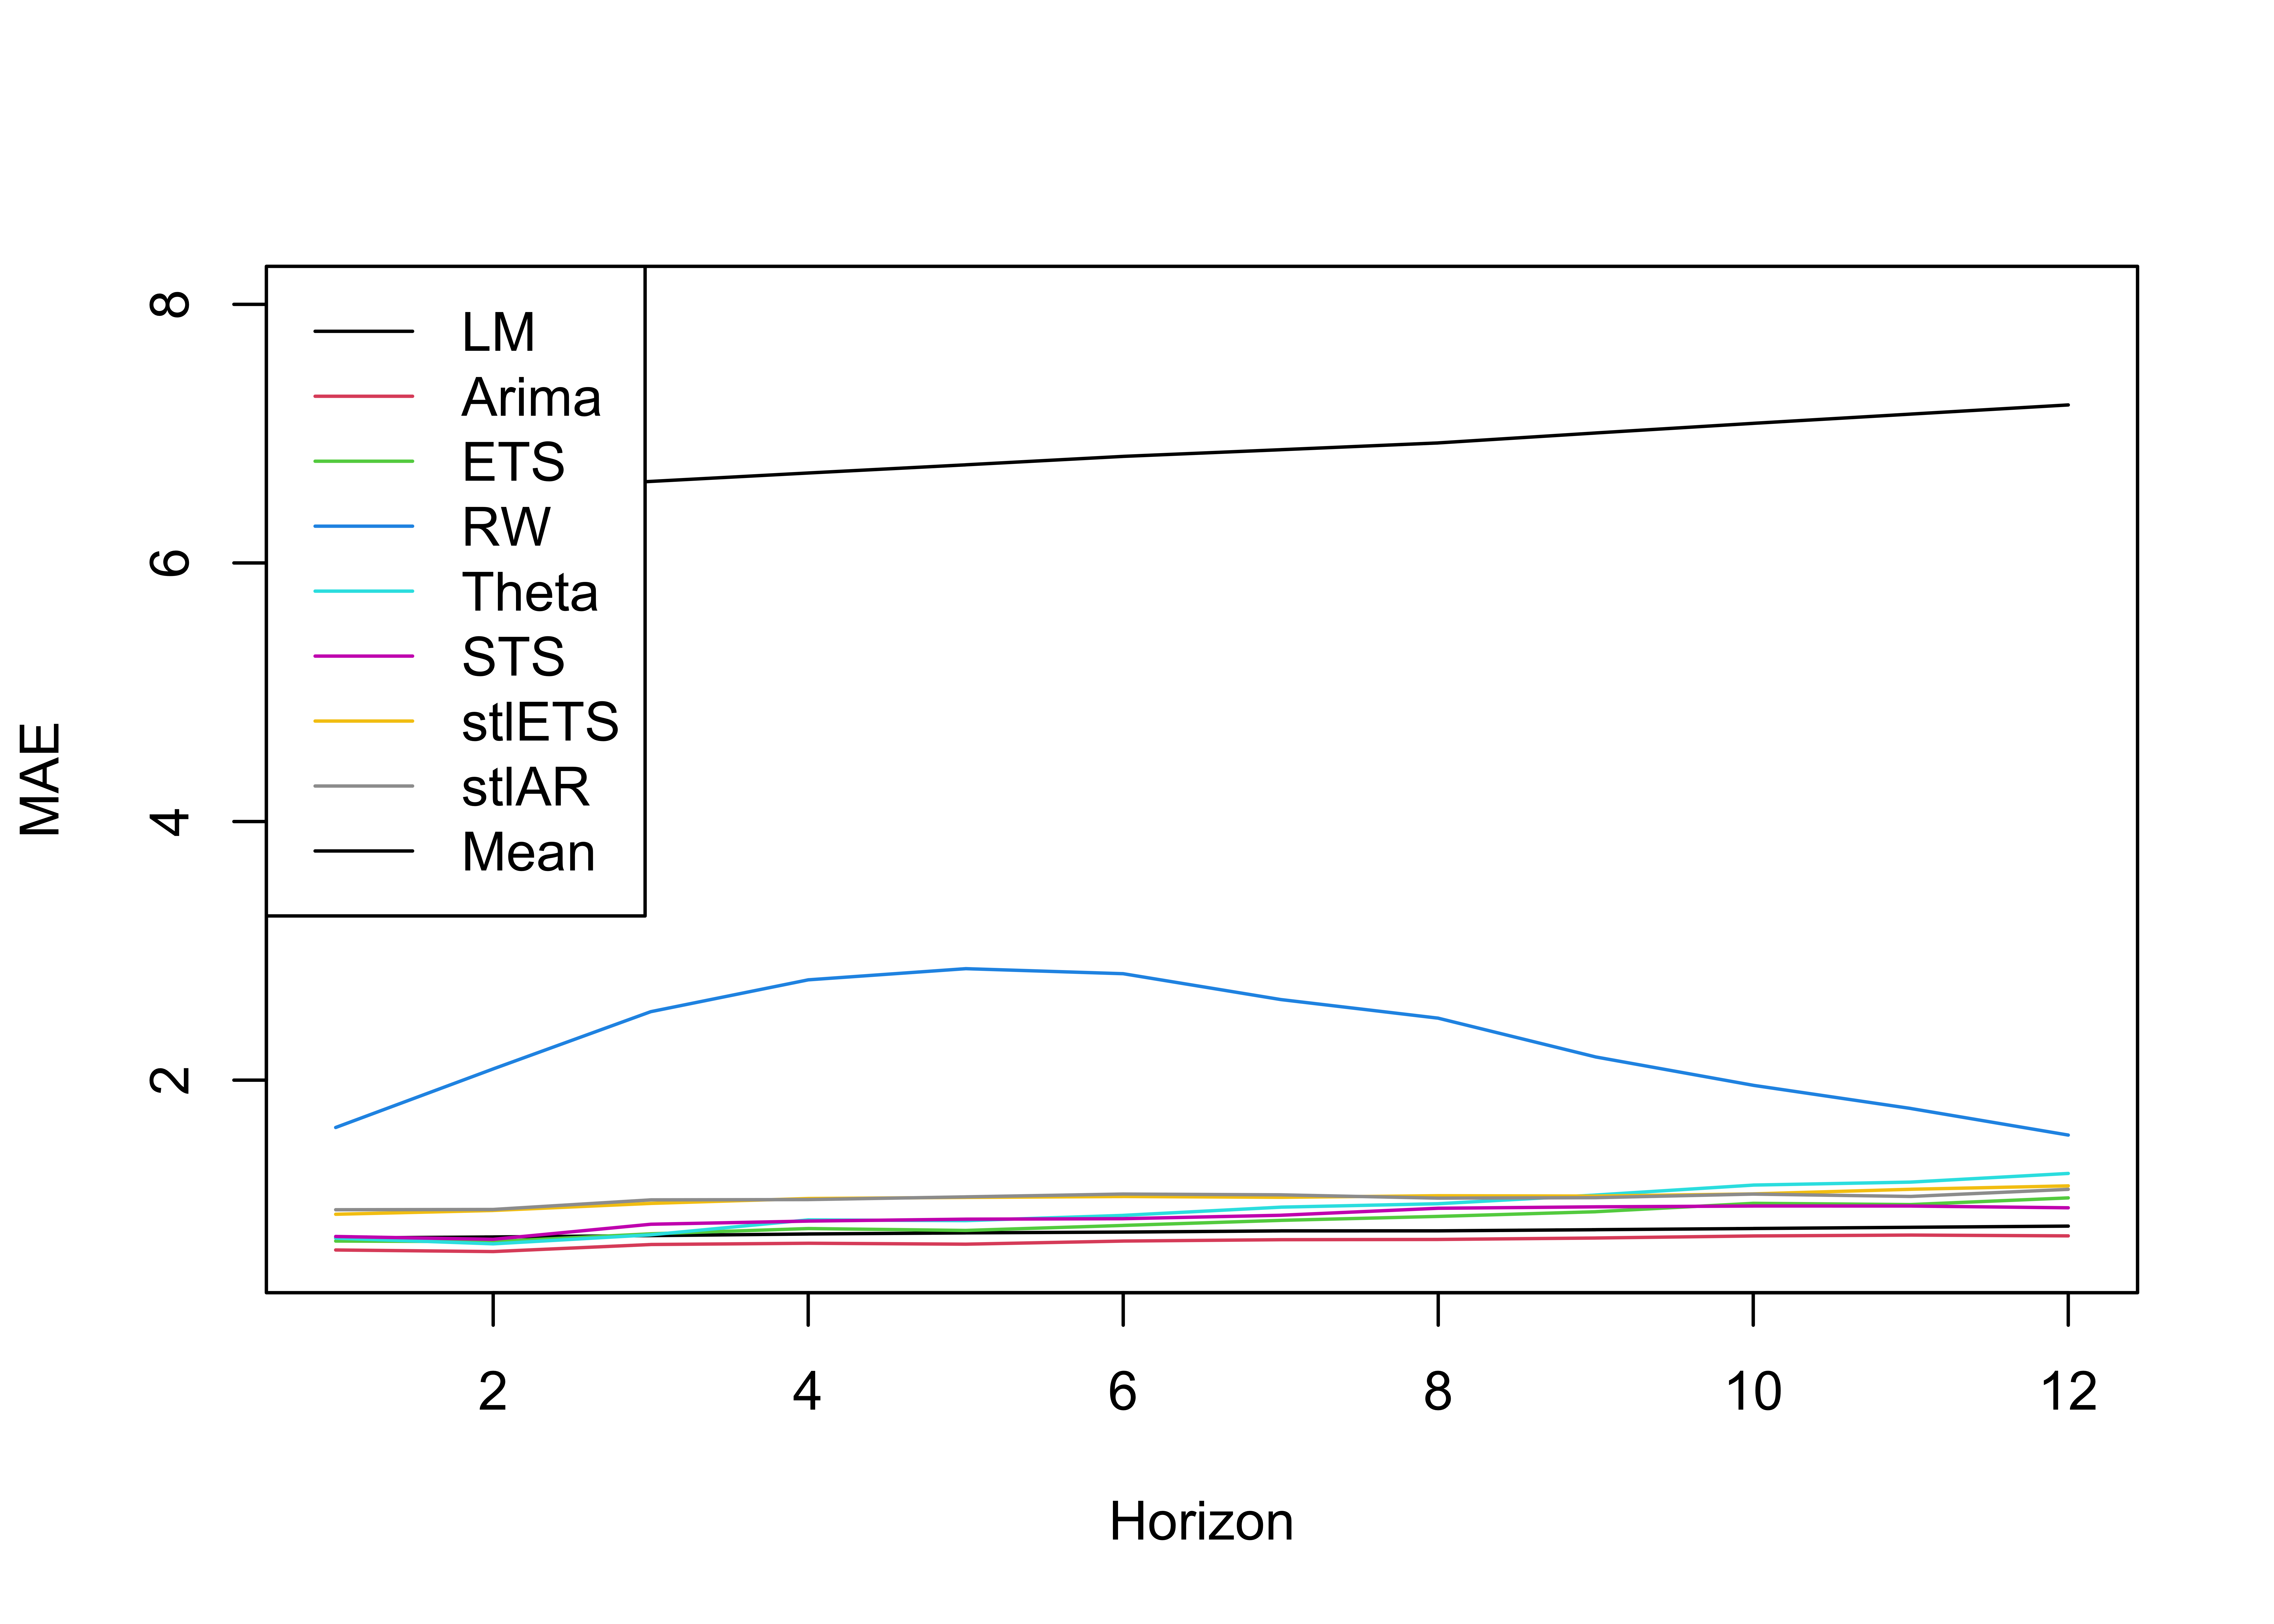
Here is the resulting figure. As you can see, the mean forecast is very inaccurate, but provides a useful baseline. The random walk forecast and the theta forecast are both improvements, but they ignore the function’s seasonal component and have a clear seasonal error pattern. StructTS and STL are clustered down at the bottom with accuracies similar to the linear model, arima model, and exponential smoothing model:
HZ <- 12
plot(LM$results[1:HZ,'MAE'],col=1,type='l',ylim=c(.65, 8), ylab='MAE', xlab='Horizon')
lines(AR$results[1:HZ,'MAE'],col=2,type='l')
lines(ETS$results[1:HZ,'MAE'],col=3,type='l')
lines(RW$results[1:HZ,'MAE'],col=4,type='l', ylab='MAE', xlab='Horizon')
lines(TM$results[1:HZ,'MAE'],col=5,type='l', ylab='MAE', xlab='Horizon')
lines(sts$results[1:HZ,'MAE'],col=6,type='l', ylab='MAE', xlab='Horizon')
lines(stlETS$results[1:HZ,'MAE'],col=7,type='l', ylab='MAE', xlab='Horizon')
lines(stlAR$results[1:HZ,'MAE'],col=8,type='l', ylab='MAE', xlab='Horizon')
lines(MM$results[1:HZ,'MAE'],col=9,type='l', ylab='MAE', xlab='Horizon')
legend("topleft",legend=c('LM','Arima','ETS','RW','Theta','STS','stlETS','stlAR','Mean'),
        col=1:9,lty=1)

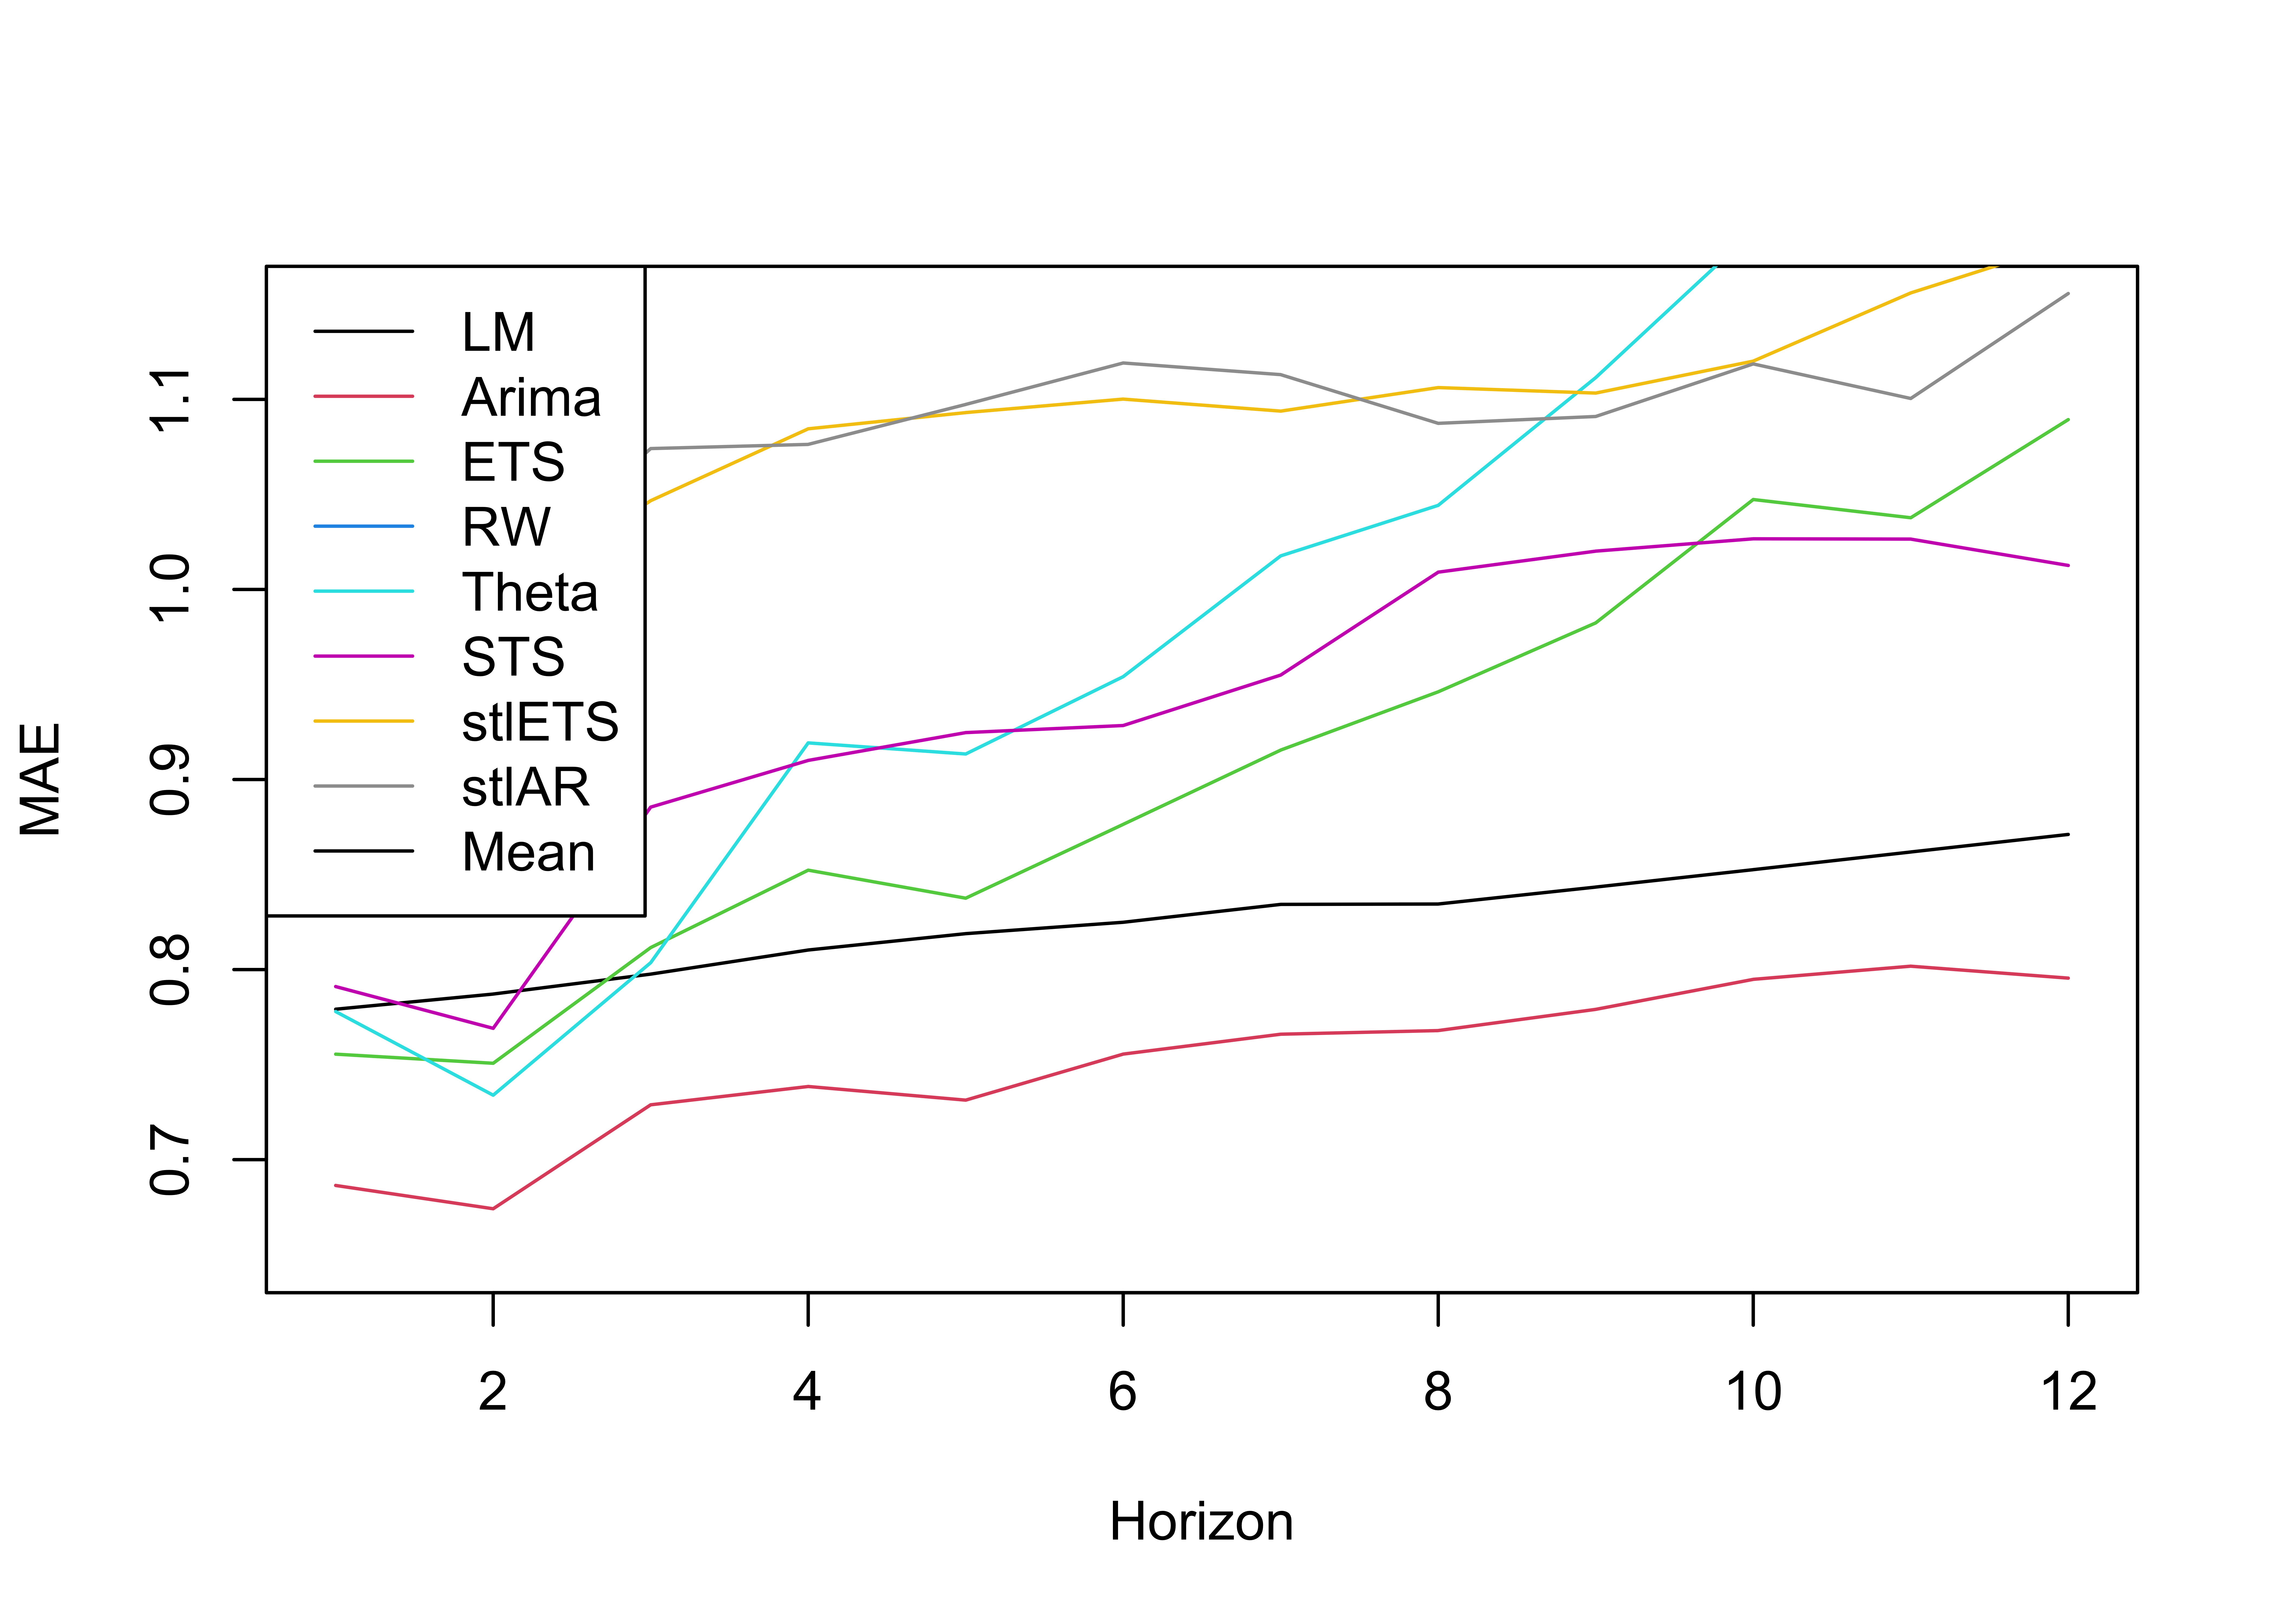
If we zoom in on the better models we get the following figure:
HZ <- 12
plot(LM$results[1:HZ,'MAE'],col=1,type='l',ylim=c(0.65,1.15), ylab='MAE', xlab='Horizon')
lines(AR$results[1:HZ,'MAE'],col=2,type='l')
lines(ETS$results[1:HZ,'MAE'],col=3,type='l')
lines(RW$results[1:HZ,'MAE'],col=4,type='l', ylab='MAE', xlab='Horizon')
lines(TM$results[1:HZ,'MAE'],col=5,type='l', ylab='MAE', xlab='Horizon')
lines(sts$results[1:HZ,'MAE'],col=6,type='l', ylab='MAE', xlab='Horizon')
lines(stlETS$results[1:HZ,'MAE'],col=7,type='l', ylab='MAE', xlab='Horizon')
lines(stlAR$results[1:HZ,'MAE'],col=8,type='l', ylab='MAE', xlab='Horizon')
lines(MM$results[1:HZ,'MAE'],col=9,type='l', ylab='MAE', xlab='Horizon')
legend("topleft",legend=c('LM','Arima','ETS','RW','Theta','STS','stlETS','stlAR','Mean'),
        col=1:9,lty=1)

As you can see, the structural time series is close to the exponential smoothing model in accuracy, while the to seasonal decomposition models are consistently worse. The arima model still outperforms all other models, at every forecast horizon.
(Note that I’ve found a couple of bugs in my ts.cv function. It seems to not be working when fixed=TRUE, and it also doesn’t like being told to just look at 1-step forecasts. I’ll try to fix both bugs soon.)