Scraping Web Data in R
Note: This post is NOT financial advice! This is just a fun way to explore some of the capabilities R has for importing and manipulating data.
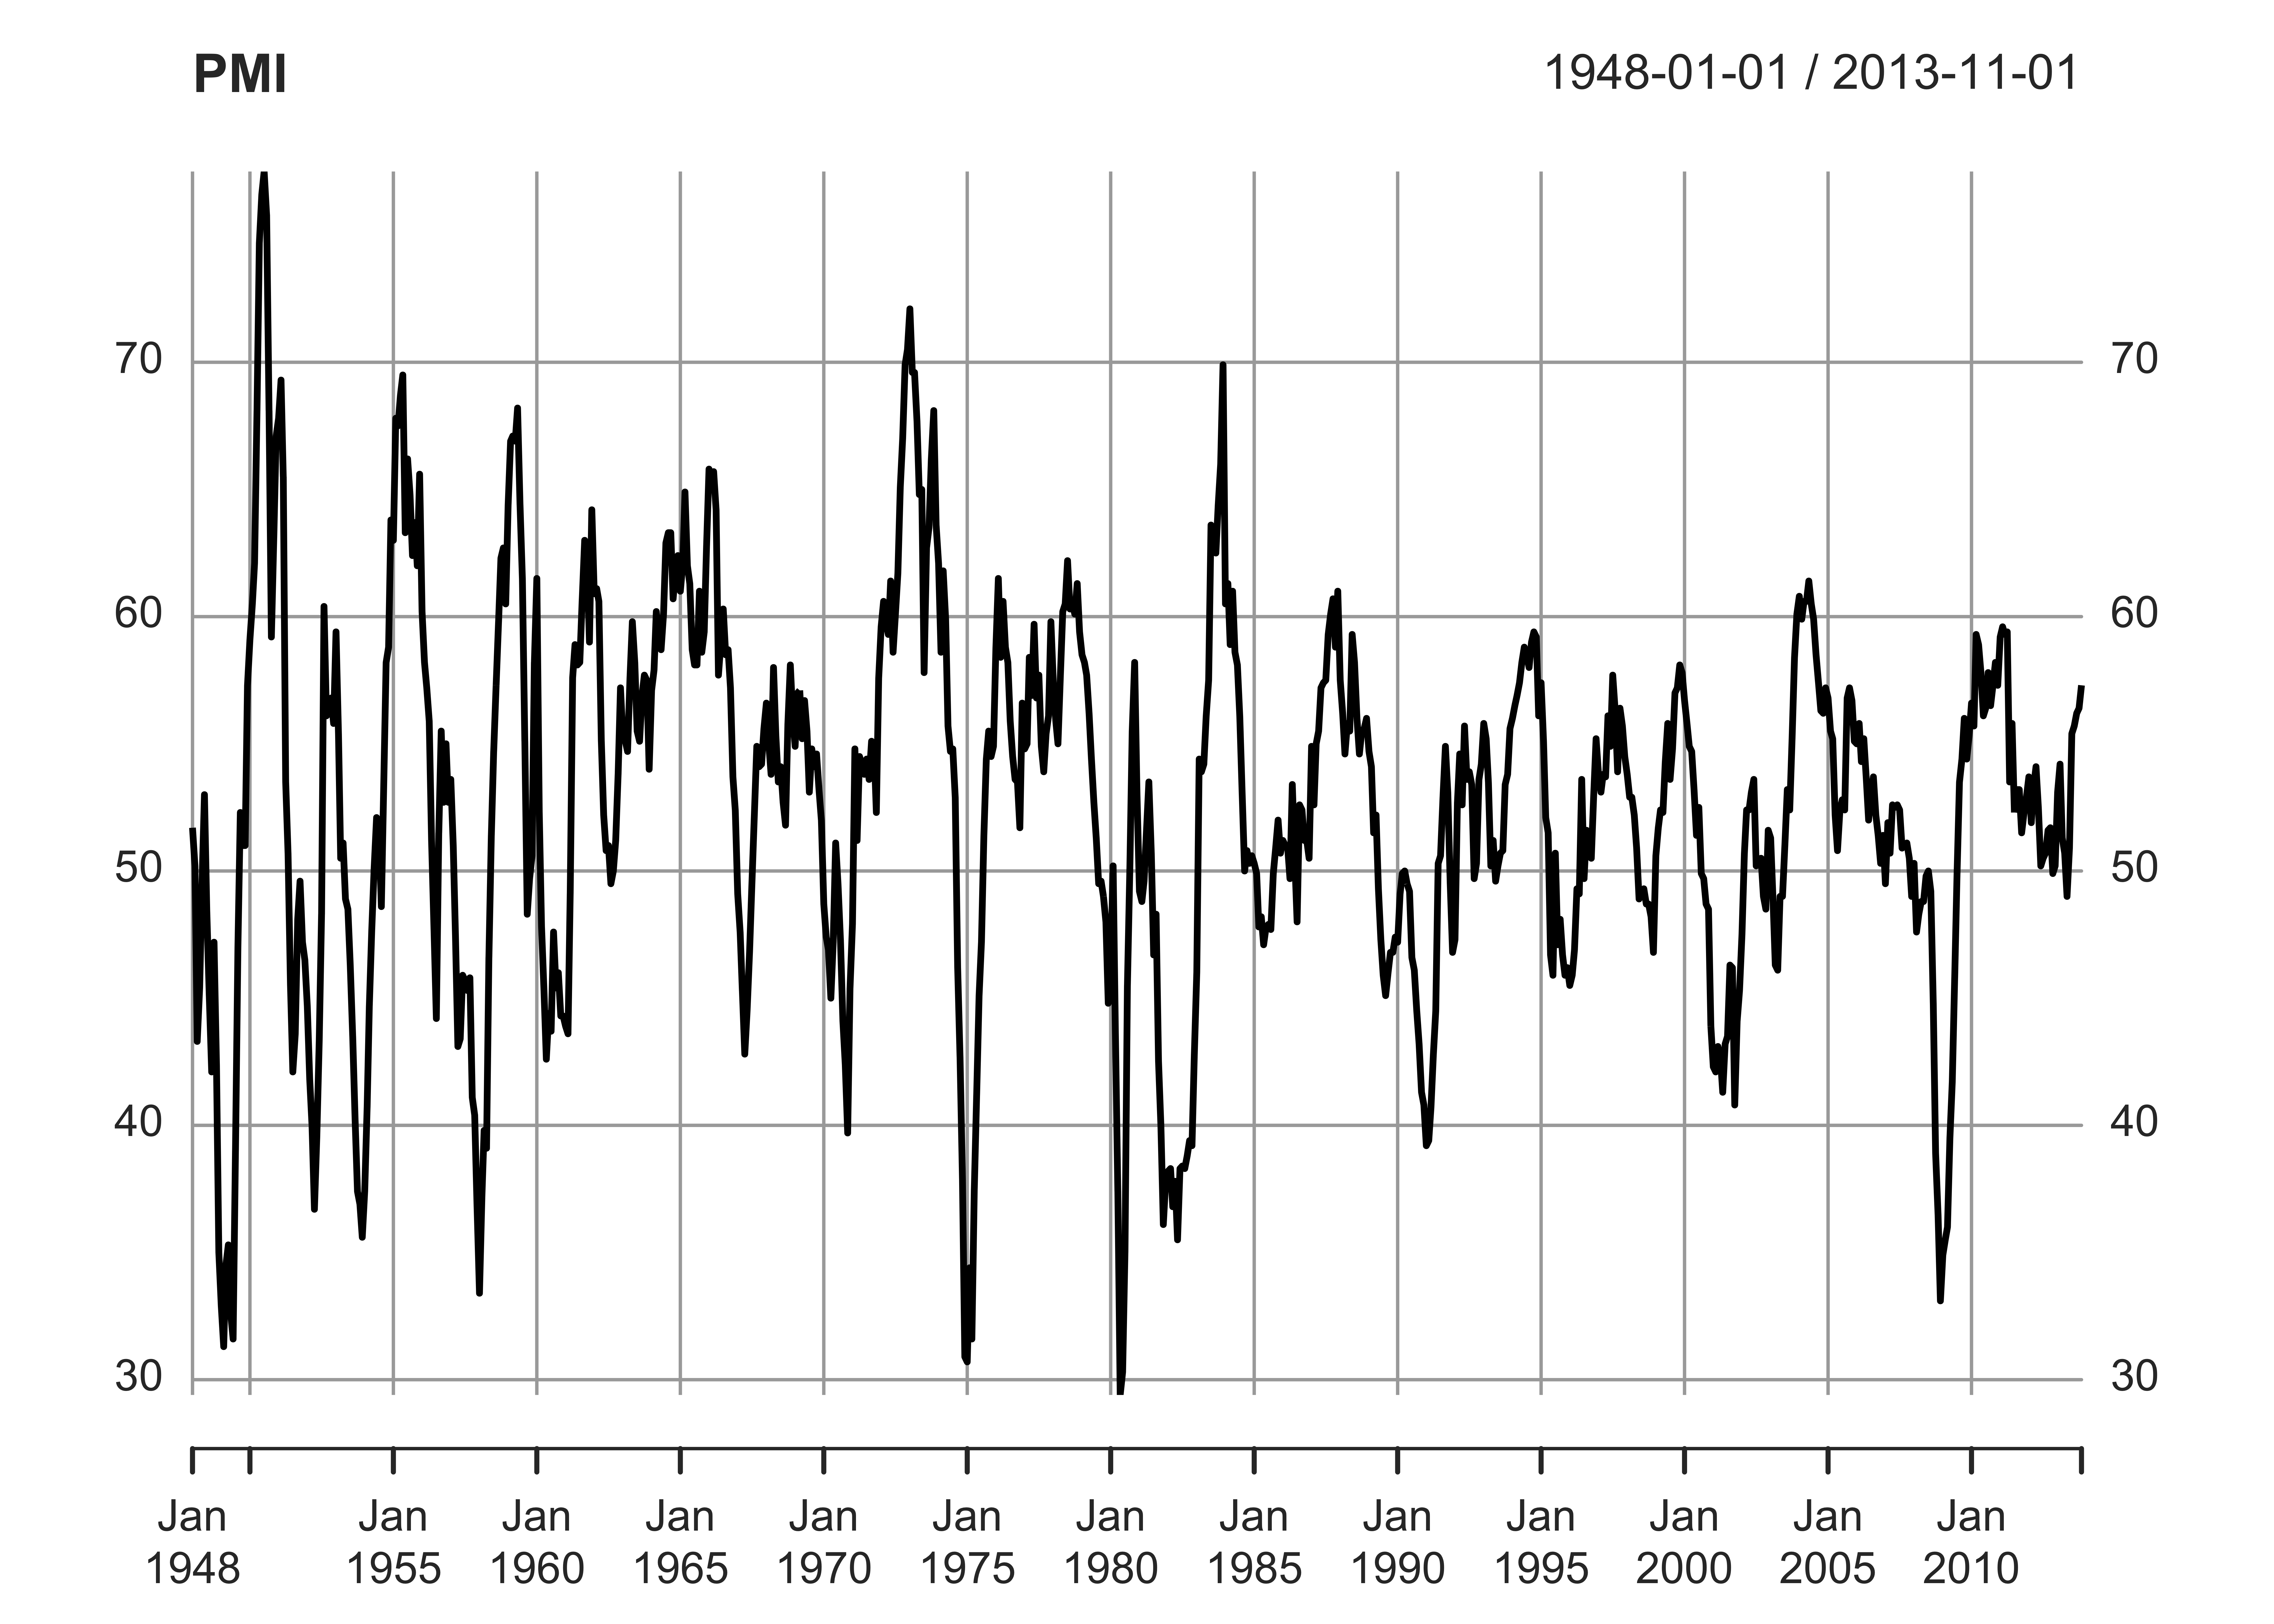
In my last post, I went through a lot of effort to scrape the PMI index off the ISM website. It turns out that was unnecessary effort, as commentator “senne” pointed out that this index is available from FRED, with the symbol NAPM. I’ve updated my code, which now pulls all the data straight from FRED.
However, it was surprisingly easy to scrape web data into R, using the readHTMLTable function in the XML package. I thought I’d keep the code I used on my blog, as it’s a good example of how easily you can pull web data into R.
library(RCurl)
library(XML)
library(xts)
set.seed(42)

#Scrape data from the website
url <- 'https://web.archive.org/web/20131224165222/http://www.ism.ws/ISMReport/content.cfm?ItemNumber=10752'
html_data <- getURL(url)
rawPMI <- readHTMLTable(html_data)
PMI <- data.frame(rawPMI[[1]])
names(PMI)[1] <- 'Year'

#Reshape
library(reshape2)
PMI <- melt(PMI,id.vars='Year')
names(PMI) <- c('Year','Month','PMI')
PMI$PMI <- as.numeric(as.character(PMI$PMI))
PMI <- na.omit(PMI)

#Convert to XTS
numMonth <- function(x) {
    months <- list(jan=1,feb=2,mar=3,apr=4,may=5,jun=6,jul=7,aug=8,sep=9,oct=10,nov=11,dec=12)
    x <- tolower(x)
    sapply(x,function(x) months[[x]])
}
PMI$Month <- numMonth(PMI$Month)
PMI$Date <- paste(PMI$Year,PMI$Month,'1',sep='-')
PMI$Date <- as.Date(PMI$Date,format='%Y-%m-%d')
PMI <- xts(PMI$PMI,order.by=PMI$Date)
names(PMI) <- 'PMI'
plot(PMI)
