Parallelizing and Cross-validating Feature Selection in R
This is an example piece of code for the Overfitting competition at kaggle.com. This method has an AUC score of ~.91, which is currently good enough for about 38th place on the leaderboard. If you read the competition forums closely, you will find code that is good enough to tie for 25th place, as well as hints as to how to break into the top 10.
You can find the data for this post here.
However, I like this script because it does 2 tricky things well, without over fitting: 1. It selects features, despite the curse of dimensionality (250 observations, 200 features) 2. It fits a linear model, using the elastic net.
In future posts, I will walk you through how this code works, but for now, download the data and give it a shot!
#Load Required Packages
library('caret')
library('glmnet')
library('ipred')
library('e1071')
library('caTools')
set.seed(42)

############################
# Load the Data, choose target, create train and test sets
############################

Data <- read.csv("../../../public/data/overfitting.csv", header=TRUE)

#Choose Target
Data$Target <- as.factor(ifelse(Data$Target_Practice==1,'X1','X0'))
Data$Target_Evaluate = NULL
Data$Target_Leaderboard = NULL
Data$Target_Practice = NULL

#Order
xnames <- setdiff(names(Data),c('Target','case_id','train'))
Data <- Data[,c('Target','case_id','train',xnames)]

#Split to train and test
trainset = Data[Data$train == 1,]
testset = Data[Data$train == 0,]

#Remove unwanted columns
trainset$case_id = NULL
trainset$train = NULL

#Define Formula
FL <- as.formula(paste("Target ~ ", paste(xnames, collapse= "+")))

####################################
# RFE parameters
####################################
library(ipred)
library(e1071)

#Custom Functions
glmnetFuncs <- caretFuncs #Default caret functions

glmnetFuncs$fit <- function (x, y, first, last, ...) { #Fits a GLMNET model
    library("glmnet")
    glmnet(as.matrix(x), y, family = "multinomial", alpha = 0, lambda = 0.02)
}

glmnetFuncs$pred <- function (object, x) { #Makes predictions (in a format other cart functions recognize) from a glmnet model
    tmp <- predict(object, newx=as.matrix(x))
    tmp <- data.frame(tmp)
    names(tmp) <- sub('.s0','',names(tmp))
    tmp$pred <- ifelse(tmp[,1]>tmp[,2],names(tmp)[1],names(tmp)[2])
    tmp
}

glmnetFuncs$rank <- function (object, x, y) { #Ranks predictions, and numbers them from best to worst
    vimp <- sort(object$beta[[2]][, 1])
    vimp <- as.data.frame(vimp)
    vimp$var <- row.names(vimp)
    vimp$'Overall' <- seq(nrow(vimp),1)
    vimp
}

glmnetFuncs$summary <- function (data, lev = NULL, model = NULL) { #Computes Sens, Spec. and ROC for a given model
    if (is.character(data$obs)) {
        data$obs <- factor(data$obs, levels = lev)
    }
    if (is.character(data$pred)) {
        data$pred <- factor(data$pred, levels = lev)
    }
    twoClassSummary(data, lev = lev, model = NULL)
}

MyRFEcontrol <- rfeControl(
        functions = glmnetFuncs,
        method = "repeatedCV",
        number = 10,
        repeats = 5,
        rerank = FALSE,
        returnResamp = "final",
        saveDetails = FALSE,
        verbose = FALSE)

####################################
# Training parameters
####################################
MyTrainControl=trainControl(
        method = "repeatedCV",
        number=10,
        repeats=5,
        returnResamp = "all",
        classProbs = TRUE,
        summaryFunction=twoClassSummary
        )

####################################
# Setup Multicore
####################################
#source:
#http://www.r-bloggers.com/feature-selection-using-the-caret-package/
if ( require("multicore", quietly = TRUE, warn.conflicts = FALSE) ) {
    MyRFEcontrol$workers <- multicore:::detectCores()
    MyRFEcontrol$computeFunction <- mclapply
    MyRFEcontrol$computeArgs <- list(mc.preschedule = FALSE, mc.set.seed = FALSE)

    MyTrainControl$workers <- multicore:::detectCores()
    MyTrainControl$computeFunction <- mclapply
    MyTrainControl$computeArgs <- list(mc.preschedule = FALSE, mc.set.seed = FALSE)
}

####################################
# Select Features
####################################

x <- trainset[,xnames]
y <- trainset$Target

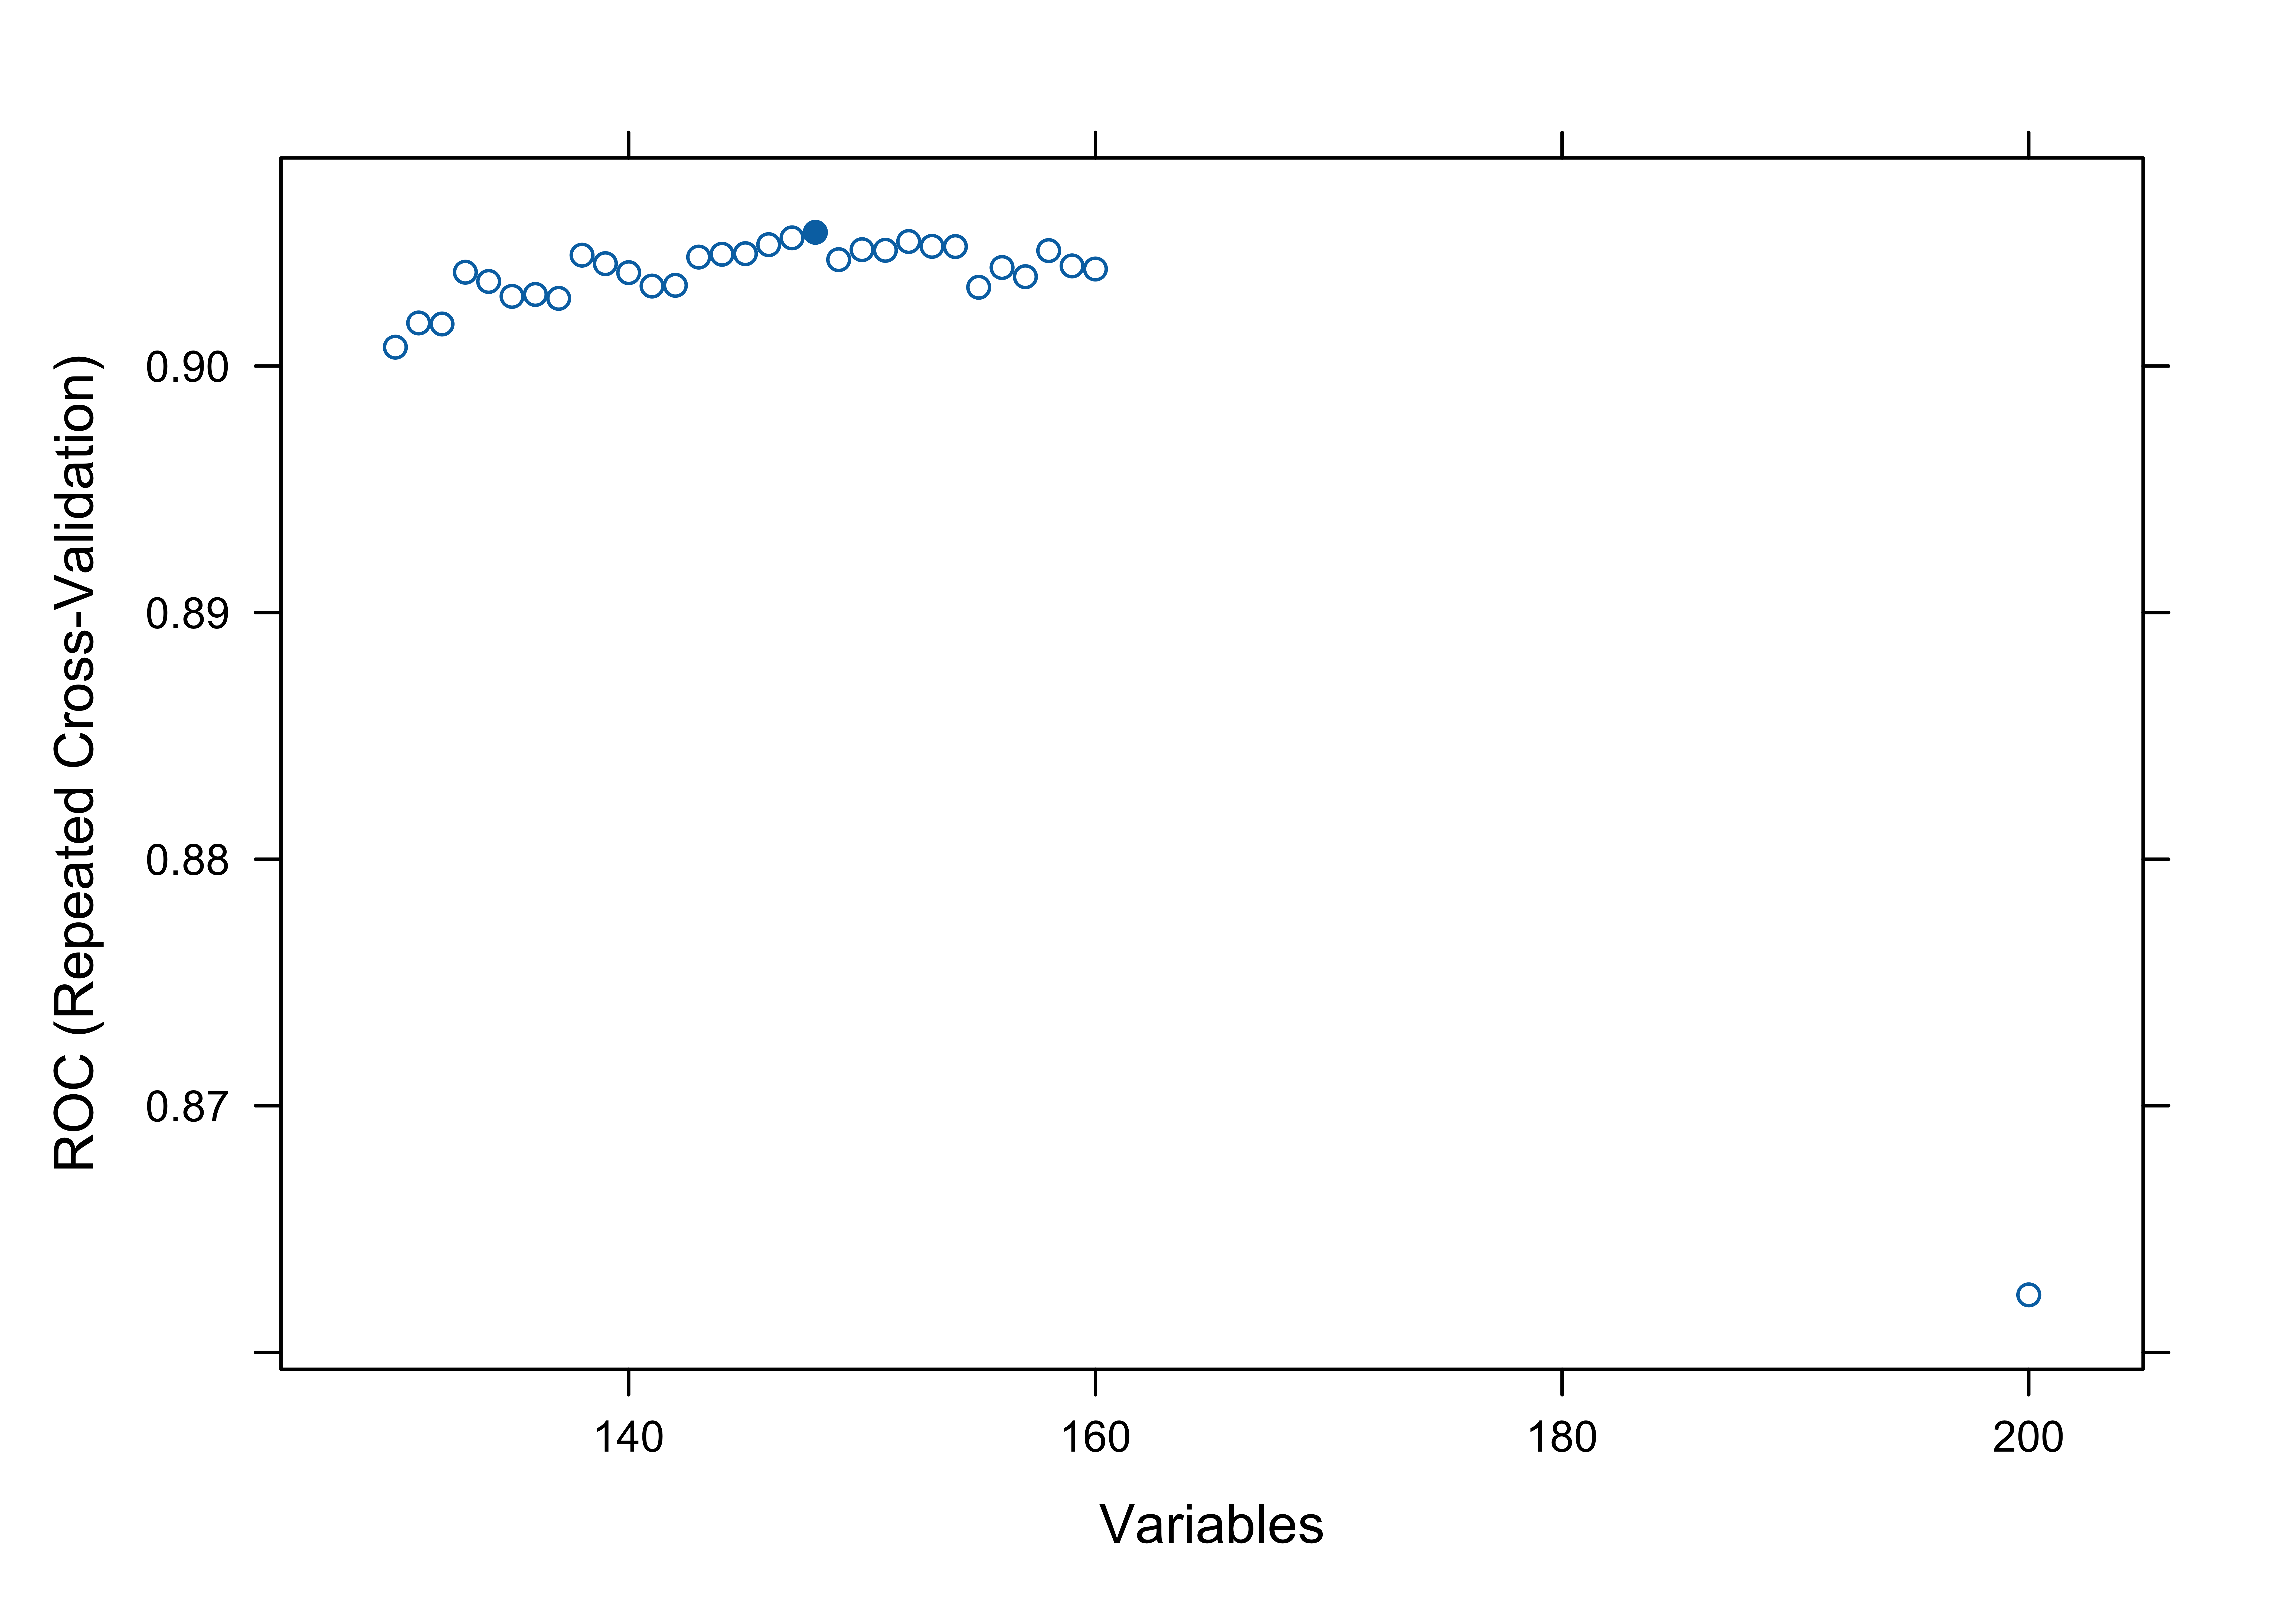
RFE <- rfe(x,y,sizes = seq(130,160,by=1), #Optimal # of features seems to be within ~130-160
    metric='ROC',
    maximize=TRUE,
    rfeControl = MyRFEcontrol)

NewVars <- RFE$optVariables
FL <- as.formula(paste("Target ~ ", paste(NewVars, collapse= "+")))
RFE
#>
#> Recursive feature selection
#>
#> Outer resampling method: Cross-Validated (10 fold, repeated 5 times)
#>
#> Resampling performance over subset size:
#>
#>  Variables    ROC   Sens   Spec   ROCSD SensSD  SpecSD Selected
#>        130 0.9008 0.7845 0.8367 0.05650 0.1303 0.09784
#>        131 0.9017 0.7930 0.8382 0.05502 0.1221 0.10101
#>        132 0.9017 0.7914 0.8398 0.05491 0.1244 0.09173
#>        133 0.9038 0.7947 0.8430 0.05550 0.1244 0.09693
#>        134 0.9034 0.7947 0.8430 0.05577 0.1266 0.09693
#>        135 0.9028 0.7930 0.8446 0.05700 0.1244 0.09734
#>        136 0.9029 0.7947 0.8400 0.05627 0.1232 0.10022
#>        137 0.9027 0.7947 0.8459 0.05433 0.1197 0.10326
#>        138 0.9045 0.7947 0.8475 0.05419 0.1197 0.10266
#>        139 0.9042 0.7930 0.8429 0.05340 0.1198 0.10084
#>        140 0.9038 0.7914 0.8459 0.05307 0.1186 0.09344
#>        141 0.9032 0.7847 0.8384 0.05403 0.1254 0.10094
#>        142 0.9033 0.7930 0.8459 0.05401 0.1149 0.10089
#>        143 0.9044 0.7930 0.8475 0.05306 0.1149 0.09660
#>        144 0.9045 0.7930 0.8429 0.05313 0.1198 0.09338
#>        145 0.9046 0.7980 0.8429 0.05332 0.1172 0.08805
#>        146 0.9049 0.8014 0.8475 0.05210 0.1194 0.09014
#>        147 0.9052 0.7914 0.8429 0.05316 0.1278 0.09207
#>        148 0.9054 0.7980 0.8459 0.05194 0.1172 0.09599        *
#>        149 0.9043 0.7930 0.8429 0.05272 0.1233 0.09593
#>        150 0.9047 0.7930 0.8429 0.05419 0.1267 0.10084
#>        151 0.9047 0.7914 0.8444 0.05409 0.1244 0.10028
#>        152 0.9051 0.7964 0.8382 0.05339 0.1255 0.10117
#>        153 0.9049 0.7997 0.8352 0.05411 0.1219 0.10207
#>        154 0.9048 0.8014 0.8352 0.05326 0.1217 0.09471
#>        155 0.9032 0.7997 0.8398 0.05419 0.1207 0.09450
#>        156 0.9040 0.8014 0.8398 0.05433 0.1158 0.10069
#>        157 0.9036 0.7964 0.8413 0.05340 0.1111 0.10017
#>        158 0.9047 0.7997 0.8413 0.05285 0.1159 0.09896
#>        159 0.9041 0.8047 0.8321 0.05075 0.1130 0.09928
#>        160 0.9039 0.7980 0.8321 0.05043 0.1110 0.09928
#>        200 0.8623 0.7629 0.7826 0.07233 0.1309 0.12295
#>
#> The top 5 variables (out of 148):
#>    var_50, var_40, var_7, var_39, var_158
plot(RFE)

####################################
# Fit a GLMNET Model
####################################

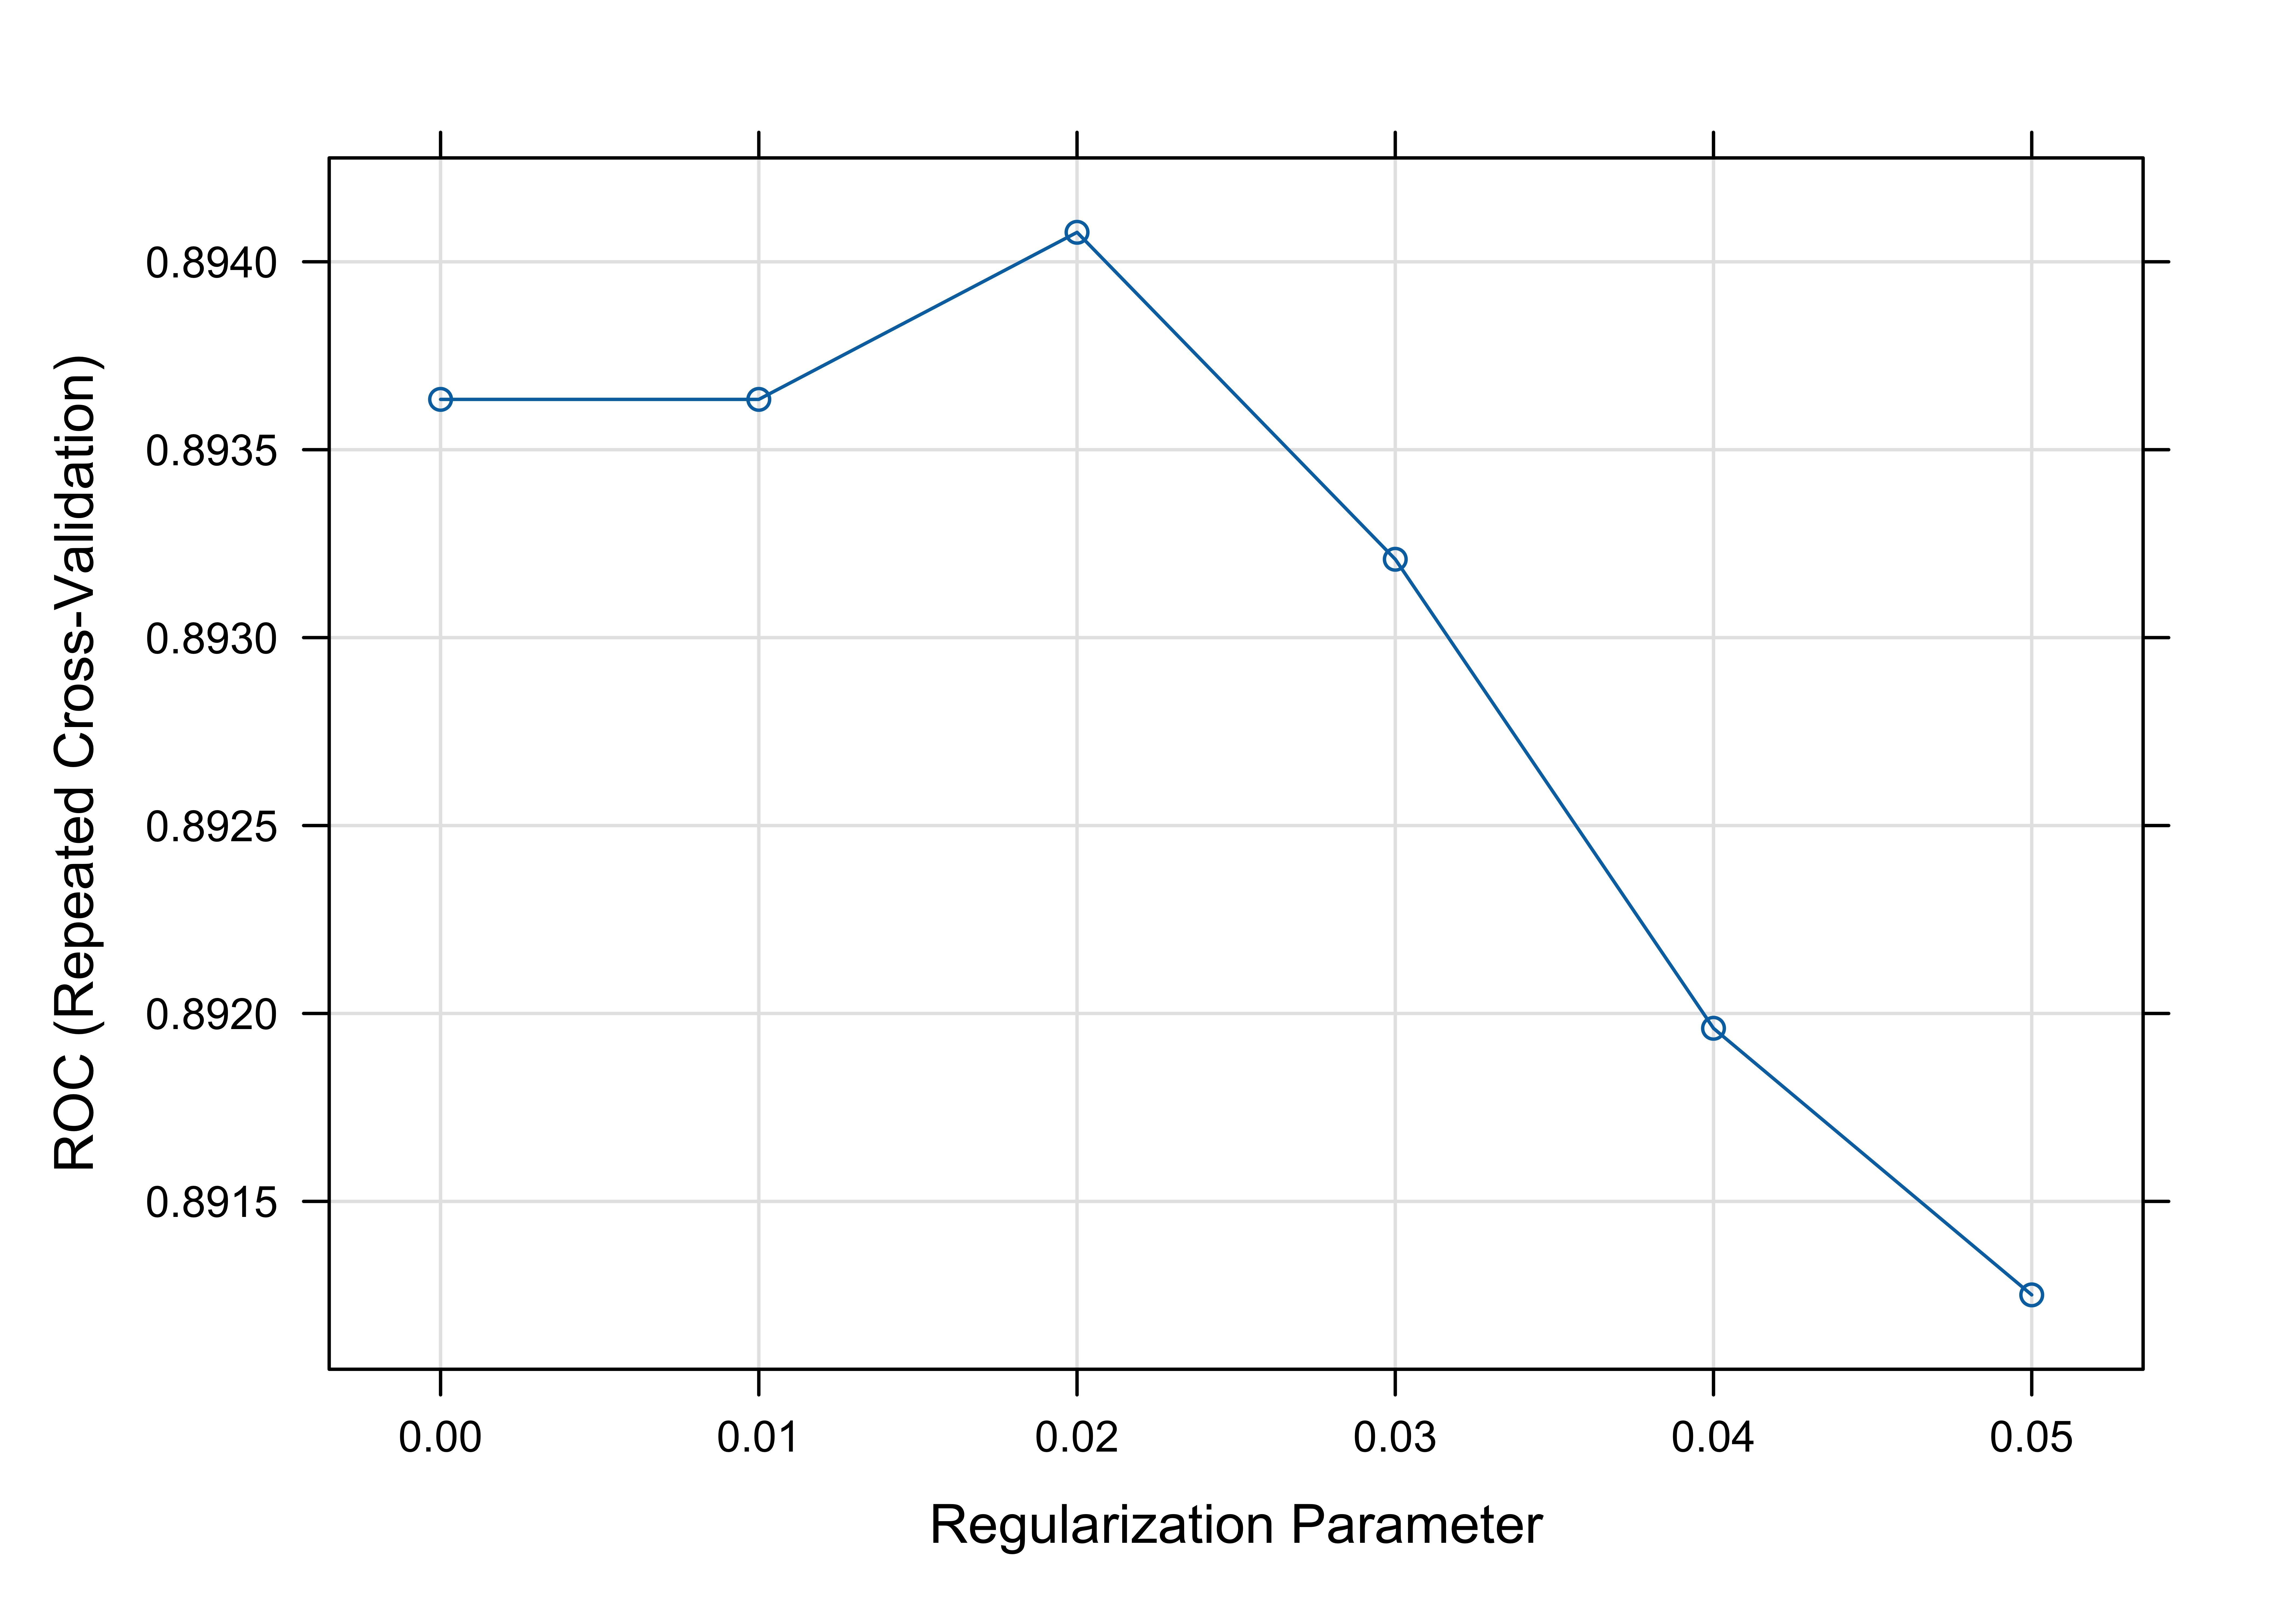
G <- expand.grid(.alpha=0,.lambda=seq(0,0.05,by=0.01))

model <- train(FL,data=trainset,method='glmnet',
    metric = "ROC",
    tuneGrid = G,
    trControl=MyTrainControl)
plot(model, metric='ROC')

predictions <- predict(model, newdata=testset, type  = "prob")
colAUC(predictions, testset$Target)
#>                  X0        X1
#> X0 vs. X1 0.9127356 0.9127356

########################################
#Generate a file for submission
########################################
testID  <- testset$case_id
submit_file = cbind(testID,predictions)
submit_file <- submit_file[,c('testID','X1','X0')]
# write.csv(submit_file, file="submission.csv", row.names = FALSE)